KTH Royal Institute of Technology
Year
2014
Duration
One semester
Project Team
3
Project focus
- UI Design
- Web development
- HTML
- CSS
- MVC framework
Deliverables
Web-app
“You cannot get through a single day without having an impact on the world around you. What you do makes a difference, and you have to decide what kind of difference you want to make.” — Jane Goodall
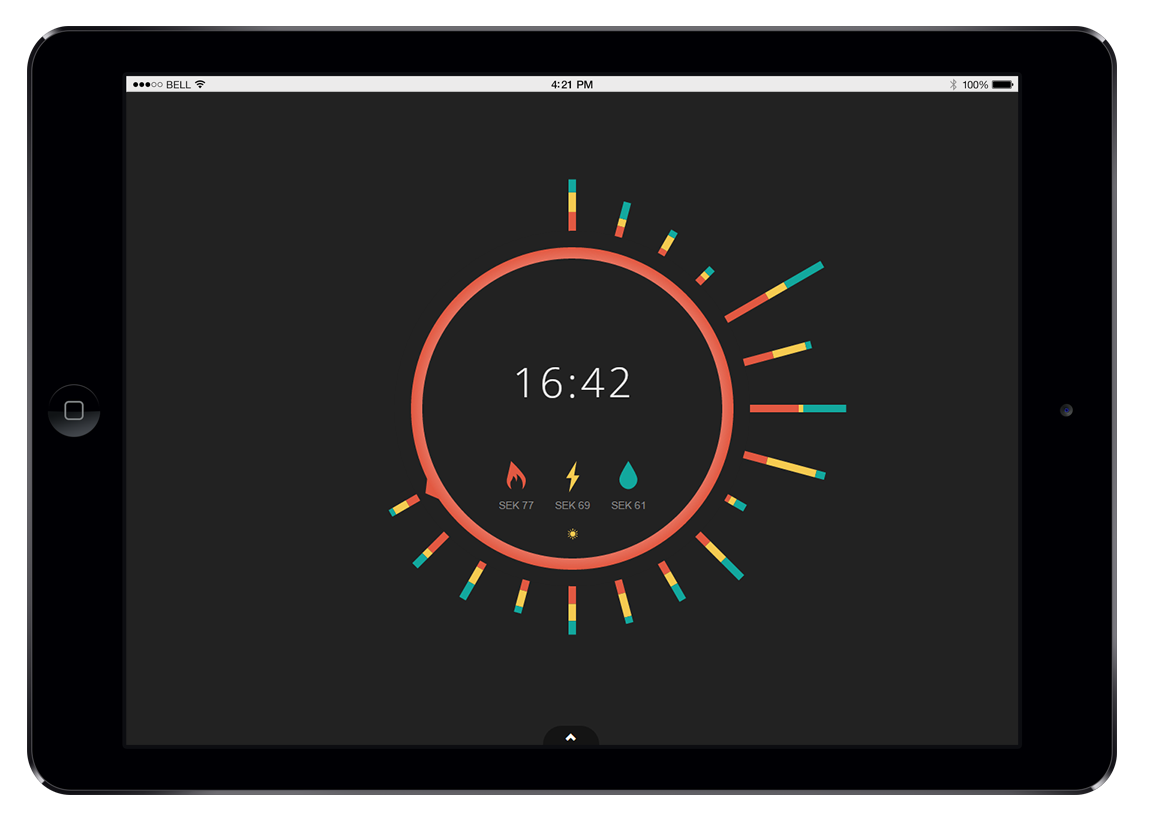
This project was started as part of a cooperation between the energy company Fortum, and the KTH Stockholm. Specifically the Visualization course tought by Mario Romero. The goal was creating awareness of energy consumption among the general population through an ambient display in the living room.
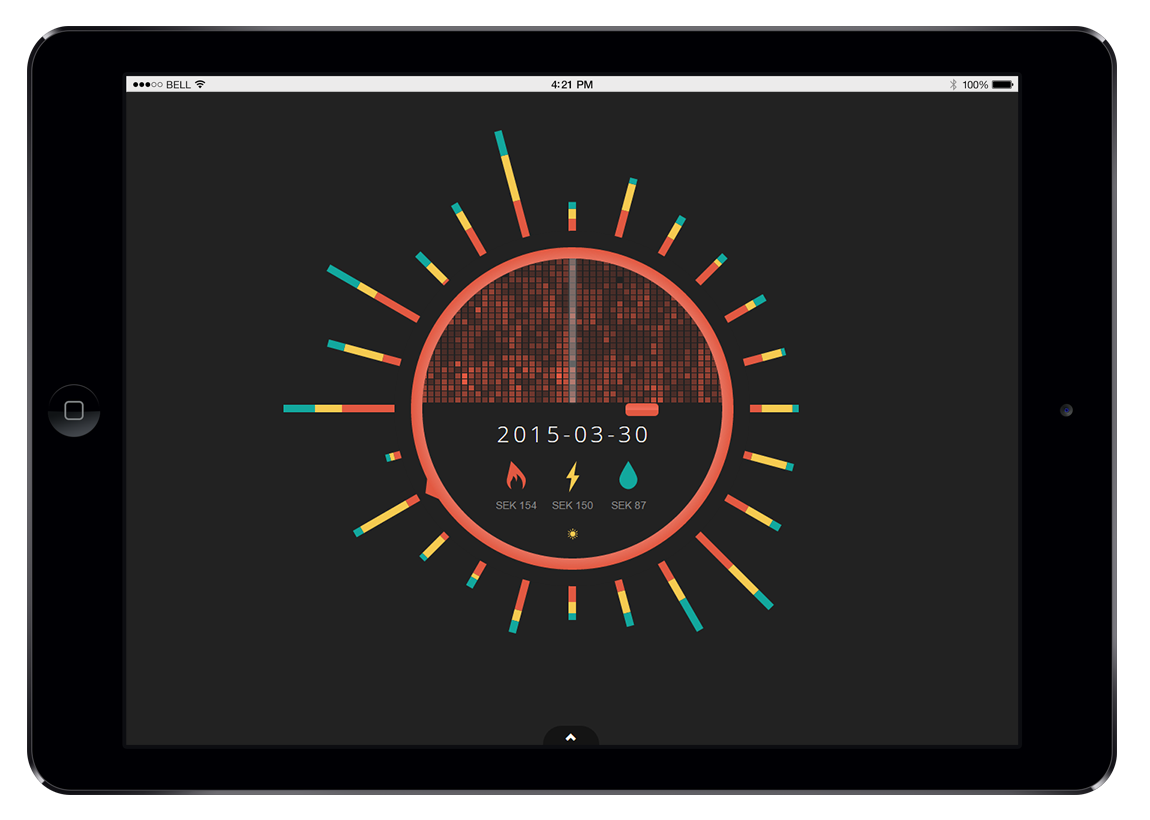
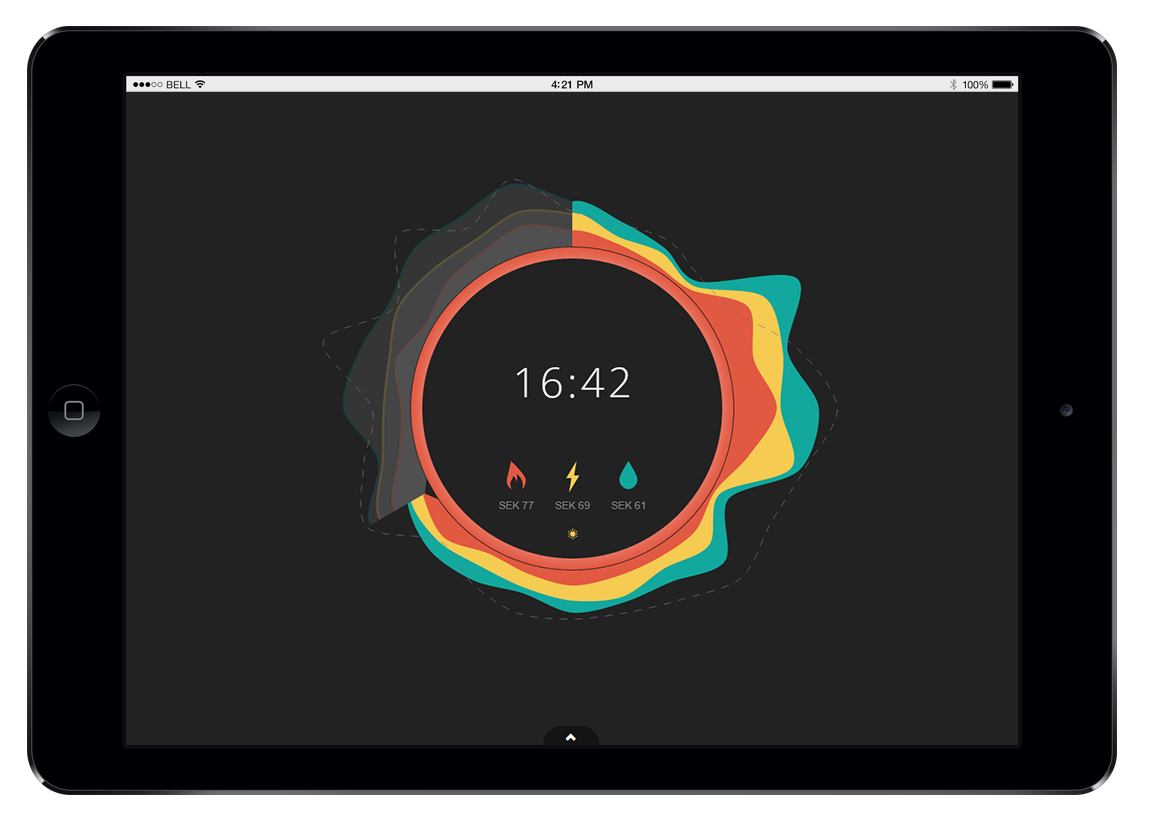
The energy clock visualizes (simulated) energy consumption data of an average household to create this awareness. By touching the bars, the user can change between different visual styles. The different types of energy can be enabled and displayed by touching their respective icons. Finally when touching the time, the user can explore the energy consumption history. This visualization is best displayed on an iPad and was created for this type of device.
Created in collaboration with Henri Schröter and Ivo van Bon.


